Overview:
Looking at the demographics of poverty is important because poverty is unequally distributed (as you will see here). Whether it is because of sex or age or race (also referred to here as ancestry), knowing who is most vulnerable is important to finding a way to help them rise out of poverty. It is also important to understand where these people are must vulnerable. Not every vulnerable group may be at risk in the same place or at the same intensity.
Map 2 shows all 100 counties in North Carolina in 2015 and their overall poverty rate.
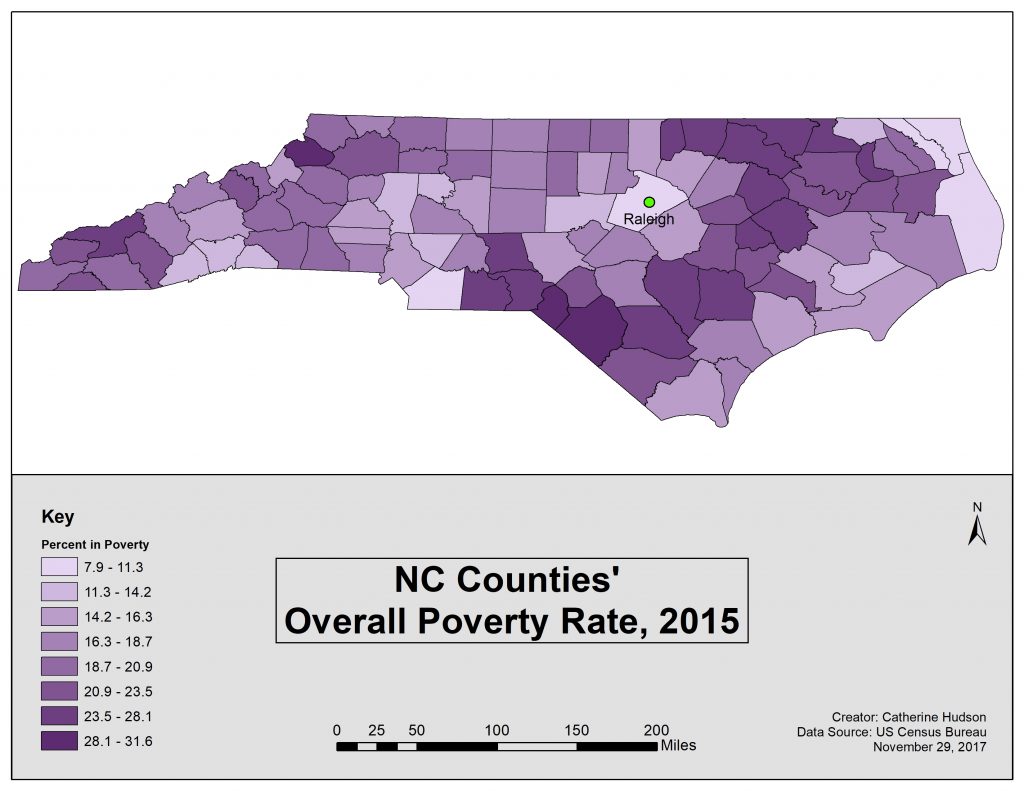
As you can see there are several groupings: one on the western most edge of the state and another that runs North-South through Central-East North Carolina. Given the scope of this site, it is unclear as to why some counties have a higher percentage than others. This could be a potential area to study in future research.
Sex
Maps 3 and 4 show the poverty rate by sex. Clicking on a map will show it as a full length page.

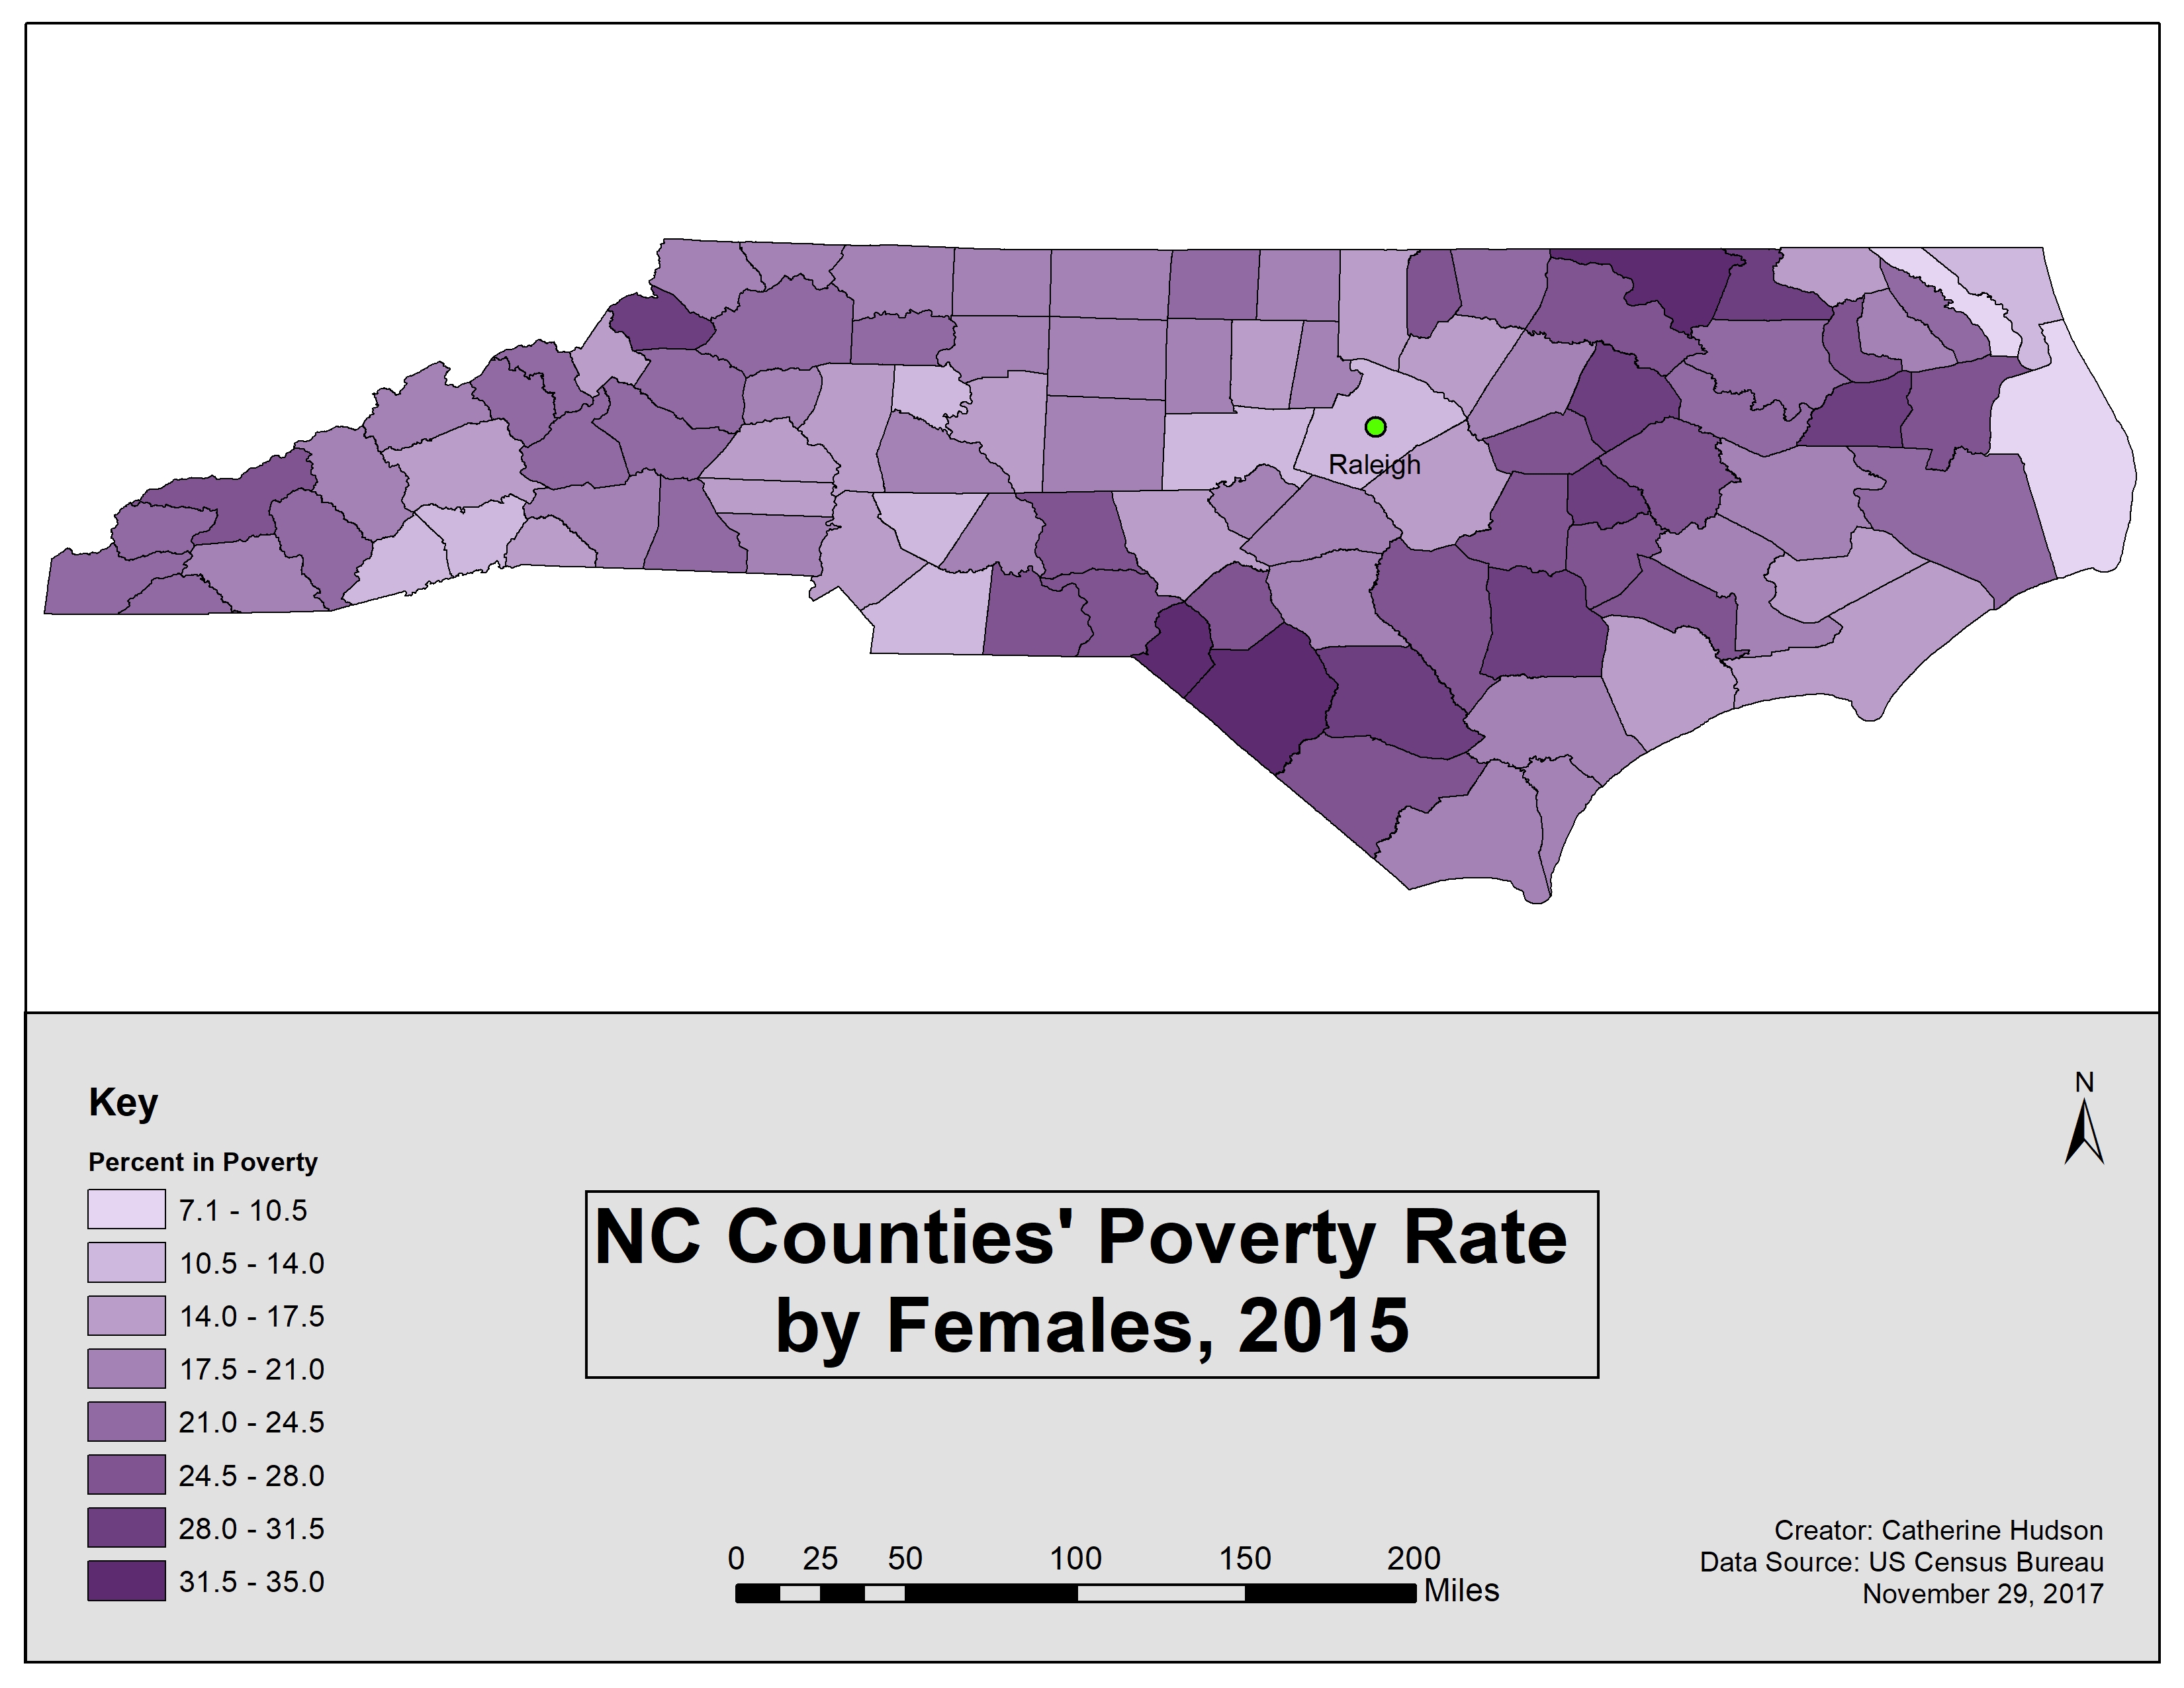
As you can see, there is a higher percentage of females living in poverty as compared to males in most of the counties. The overall estimated percent of females living in poverty in North Carolina in 2015 was 18.8% and the National average was 16.7%. The overall estimated percent of males living in poverty in North Carolina in 2015 was 15.9% and the National average was 14.2%.
The clusters identified before are still present. However, it is worth noting that the Central-Eastern cluster noticeably shows a higher percentage in Map 4 than in Map 3. It is also worth noting the single county in the North-West that stands out among its neighboring counties. Interestingly, the maps indicate that this county had a higher percentage of males in poverty than females, which differs from the overall trend.
Age
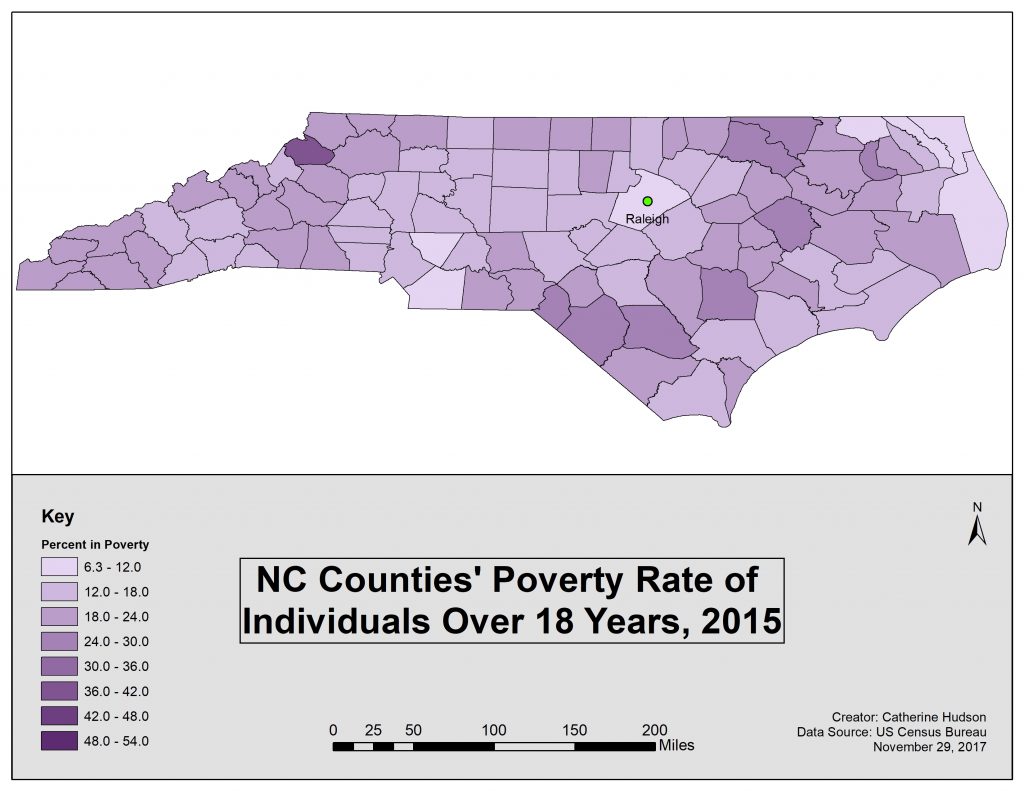
Maps 5 and 6 show the poverty rate by age, specifically under 18 years of age and over 18 years of age. Clicking on a map will show it as a full length page.
There is one thing that must be clarified. While Map 6 is titled as “Individuals Over 18 Years”, it’s official category is 18-64 year of age. The title was simplified to make comparison easier. An estimated 14% of the population of North Carolina is over the age of 65; they have just not been included here.

As you can see, while individuals under 18 years of age consist of an estimated 23.5% of the total North Carolina population, a higher percentage of their sub-population was living in poverty. In 2015, the state average for North Carolina was 24.7% and the National average was 21.7%.
The US Census Bureau has several sub-categories within under 18 years, including: under 5 years and 5-17 years. An estimated 28.4% of all individuals under 5 years in 2015 were living in poverty in North Carolina. This group comprises an estimated 30.8% of all individuals under 18 years in poverty and 7.6% of the total population of under 18 years in North Carolina. An estimated 23.4% of all individuals between 5-17 years in 2015 were living in poverty in North Carolina. This group comprises an estimated 69.2% of all individuals under 18 in poverty and 17.1% of the total population of under 18 years in North Carolina.
Therefore, of the two sub-categories, individuals 5-17 years are slightly more vulnerable within all individuals under 18 years.
As Map 5 shows, there is still the presence of the previously mentioned clustering, and there is a higher intensity in the most North and South extremes of the cluster.
Map 6 shows a lower percentage overall, with the exception of a single county in the West. The Central-East cluster is still present, though only marginally. Interestingly, some of the higher percentage counties in Map 5 are not reflected in Map 6. This is something that could be investigated further.
In 2015, the state average for North Carolina for individuals 18-64 years is 16.3%, while the National average is 15.4%. The US Census Bureau has several sub-categories within 18-64 years, including: 18-34 and 35-64. An estimated 22.6% of all individuals between 18 and 34 years of age in 2015 were living in poverty in North Carolina. This is an estimated 49% of all individuals 18-64 years in poverty and 8% of the total population of 18-64 years. An estimated 12.9% of all individuals between 35-64 years were living in poverty in North Carolina. This is an estimated 51% of the total population of all individuals 18-64 in poverty and 8.3% of the total population of 18-64 years.
Therefore, of the two sub-categories, individuals between 35-64 are slightly more vulnerable within all individuals 18-64.
Race
Maps 7 through 10 show the poverty rate by race/ancestry or ethnicity. Clicking on a map will show it as a full length page.
It is necessary to note that when race/ancestry or ethnicity is surveyed, it is self-identified. Therefore, particularly in the case of Hispanic or Latino ethnicity (shortened to Latino Origin here), individuals may choose more than one category. Furthermore, several categories provided by the Census Bureau, including Asian and Native Hawaiian or Pacific Islander, are not included here. This is because, according to the US Census Bureau, more than three counties within North Carolina did not have any individual of that race/ancestry residing within the county. Any official academic study would, of course, need to include all of the available categories.


As you can see, while there is still clustering, the previously identified clusters are not present. There are no obvious trends evident among the four maps, except for one: minority populations, on average, are more vulnerable than the majority population (White ancestry).
For the entire population in North Carolina that identified as white, 11.8% lived in poverty in 2015. The National average was 10.8%. For the entire population that identified as American Indian or Native Alaskan, 28.8% lived in poverty in 2015. The National average was 28.3%. For the entire population in North Carolina that identified as African American, 27.1% lived in poverty. The National average was 27%. For the entire population that identified themselves as of Latino or Hispanic Origin, 33.2% lived in poverty. The National average was 24.3%.
Given the significantly higher percentages of the three minority groups as compared to the White ancestry population, there is evidence to suggest that poverty disproportionately affects minority groups.