What is Poverty?
Poverty is defined by Dictionary.com as “the state or condition of having little or no money, goods, or means of support.” It is a cruel situation that no one desires to be in. However, some people are more at risk of being in poverty than others. A simple search on Google Scholar shows thousands of research articles dedicated to who poverty disproportionately effects and how.
US Census Bureau estimates poverty annually using a complicated formula involving income and number of individuals in a household to determine thresholds for poverty. If a household is found to be below the estimated threshold, then the household is considered to be impoverished. For more information as to how this all works, click on this link.
Sometimes, different phrases may be used to refer to poverty, including “below the poverty line”. I have chosen to use both “poverty” and “in poverty” to keep things simple. The phrase “Poverty Rate” is also used here and refers to the percent of individuals who have been designated as impoverished.
Where did you get the data from?
Obtaining data on poverty rates is fairly simple. The U.S. Census Bureau’s American FactFinder website has data collected through the census and through surveys available to the general public.
Purpose of this site:
This website was created to display the 2015 data from the U.S. Census Bureau and to visually show which subcategories of people are more vulnerable and where they may be most vulnerable in North Carolina.
Quick note:
There is one thing that must be noted: all of this data is from 2015. August, 2015 was the beginning of a stock market financial crisis that lasted until 2016. While this was not as severe as the “Great Recession”, which lasted in the United States from 2007 to 2009, it is worth noting that the financial crisis could have had an impact on the data. Therefore, these numbers, which are static, may not accurately represent the fluctuating world in which we live. Rather, they act as a snapshot of what things were like at that period in time. It is possible that the sub-categories identified as vulnerable to poverty on this website may not be as vulnerable during times of non-financial crisis. The purpose of this website is to show which sub-categories were vulnerable at that time. Further research into temporal changes could be done, but is not the focus here.
Subcategories:
That being said, the data is broken down through three pages: demographics, education, and employment. The demographics page sub-categorizes the data by age, sex, and race. The education page sub-categorizes the data by educational attainment. The employment page sub-categorizes the data by employment status.
Some general facts about North Carolina:
Map 1 shows the 2015 overall poverty rate by percentage in each of the 50 states.
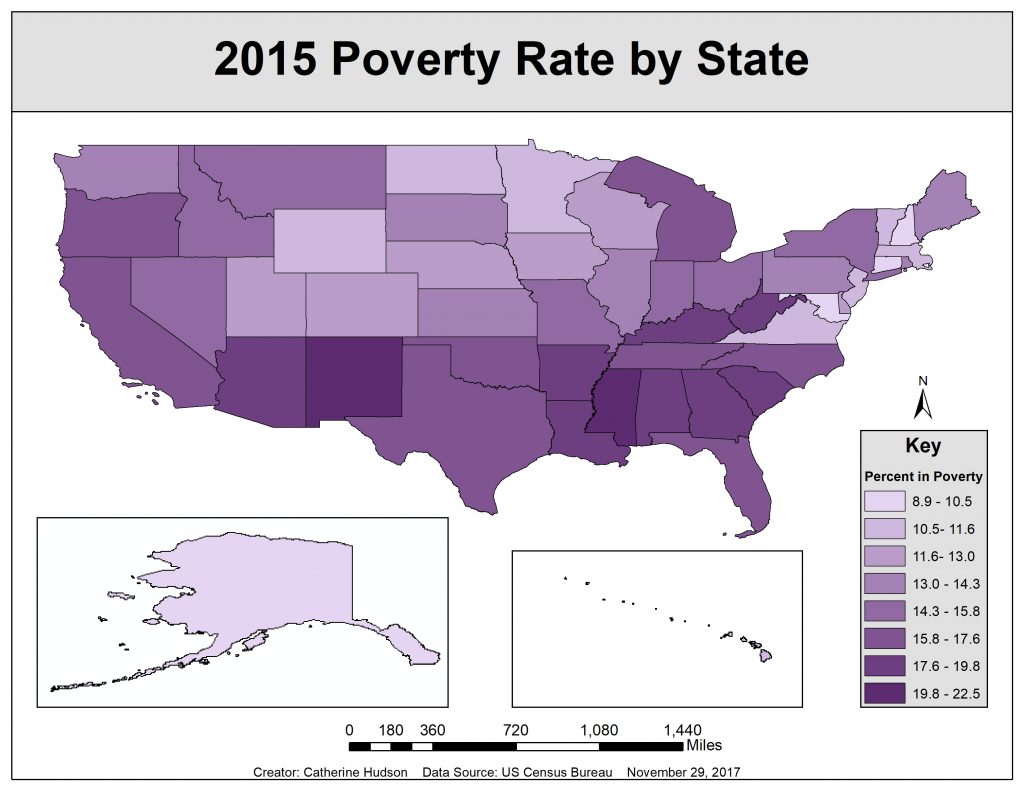
As you can see from the map, North Carolina has a higher percentage of people in poverty. North Carolina ranked 39 out of all the states for poverty in 2015 (one being the lowest and fifty being the highest). The actual percentage was 17.4%. In comparison, the state with the lowest poverty rate was New Hampshire with 8.9% and the highest was Mississippi with 22.5%. The estimated overall national average was 15.5%.
In 2015, North Carolina had an estimated population of 9,592,619 people, or, roughly 9.6 million. Of that, an estimated 1,667,455 people were living in poverty.
Contact Information:
Name: Catherine Hudson
Affiliation: NC State University, Department of Anthropology and Sociology
Email: Cghudson@ncsu.edu